WebsitesSEO and Website OptimizationTechnical OptimizationSEO audits22 min czas czytania25 630 znaków4356 słów
PageSpeed Insights — how to read the report: user data, the Lighthouse score and test settings
What each part of the PageSpeed Insights report means: 28 days of user data, the Lighthouse score, phone vs desktop, and why the score keeps changing.

Redakcja Digital VantageYour Partner in Business, Digital Vantage Team · Digital Vantage team is a group of experienced professionals combining expertise in web development, software engineering, DevOps, UX/UI design and digital marketing. Together we carry out projects from concept to implementation - websites, e-commerce stores, dedicated applications and digital strategies.
Our team combines years of experience from technology corporations with the flexibility and immediacy of working in a smaller, close-knit structure. We work in agile methodologies, focus on transparent communication and treat each project as if it were our own business.
The strength of the team is the diversity of perspectives - from systems architecture and infrastructure, frontend and design, to SEO and content marketing strategy. As a result, the client receives a cohesive solution where technology, aesthetics and business goals go hand in hand.
Publikacja
Aktualizacja
PageSpeed Insights shows two different measurements on one screen, and most confusion about the score comes from reading one half of the report as if it were the other. The top half is real Chrome user data from the last 28 days: for the exact page you entered, for the whole origin, or none at all. The bottom half is a single simulated page load by Lighthouse on an emulated mid-range phone, over a throttled connection and a slowed-down CPU.
Google describes the split directly: "Lab data is useful for debugging issues, as it is collected in a controlled environment. However, it may not capture real-world bottlenecks. Field data is useful for capturing true, real-world user experience - but has a more limited set of metrics" (About PageSpeed Insights, page updated 21 October 2024, accessed 3 October 2026). Lab data is for finding causes; field data shows how the page performs for real people.
Mixing them up produces three common questions: why the score jumps when nothing has changed; why a green 90 doesn't mean the page passes the Core Web Vitals assessment; and why you get a no-data message instead of user data. One rule answers all three: the 0–100 score is for diagnosis, and field data decides whether a page passes.
What PageSpeed Insights shows: two measurements on one screen
The top half of the report comes from the Chrome User Experience Report (CrUX), the bottom from Lighthouse — two sources that measure different things at different times. According to the same Google page, PSI shows real-user experiences for First Contentful Paint (FCP), Interaction to Next Paint (INP), Largest Contentful Paint (LCP) and Cumulative Layout Shift (CLS) "over the previous 28-day collection period", plus an experimental Time to First Byte (TTFB) metric.
The 28-day window rolls. PSI's field data is updated daily, while the CrUX dataset in BigQuery is updated monthly and holds origin-level data only; both cover the trailing 28 days (About PageSpeed Insights, accessed 3 October 2026). The numbers at the top of the report therefore describe what users experienced over the past four weeks, not today's version of the page.
The bottom half is Lighthouse: "PSI uses Lighthouse to analyze the given URL in a simulated environment for the Performance, Accessibility, Best Practices, and SEO categories". The test runs on Google's servers, and the report states the region: "PageSpeed will report running in one of: North America, Europe, or Asia" (same source).
The two halves can disagree, and that isn't a bug. Google's FAQ explains: field data is "a historical report about how a particular URL has performed", while lab data is based on "a simulated load of a page on a single device and fixed set of network conditions. As a result, the values may differ" (same source). Why lab and field diverge on specific metrics is covered in more depth in our article on Core Web Vitals.
The top half of the report: real user data
The top half of the screen answers one question: how the page performed for real people over the last 28 days. To read it correctly you need to know whose data it is, why there may be none, and what the number above the bars means.
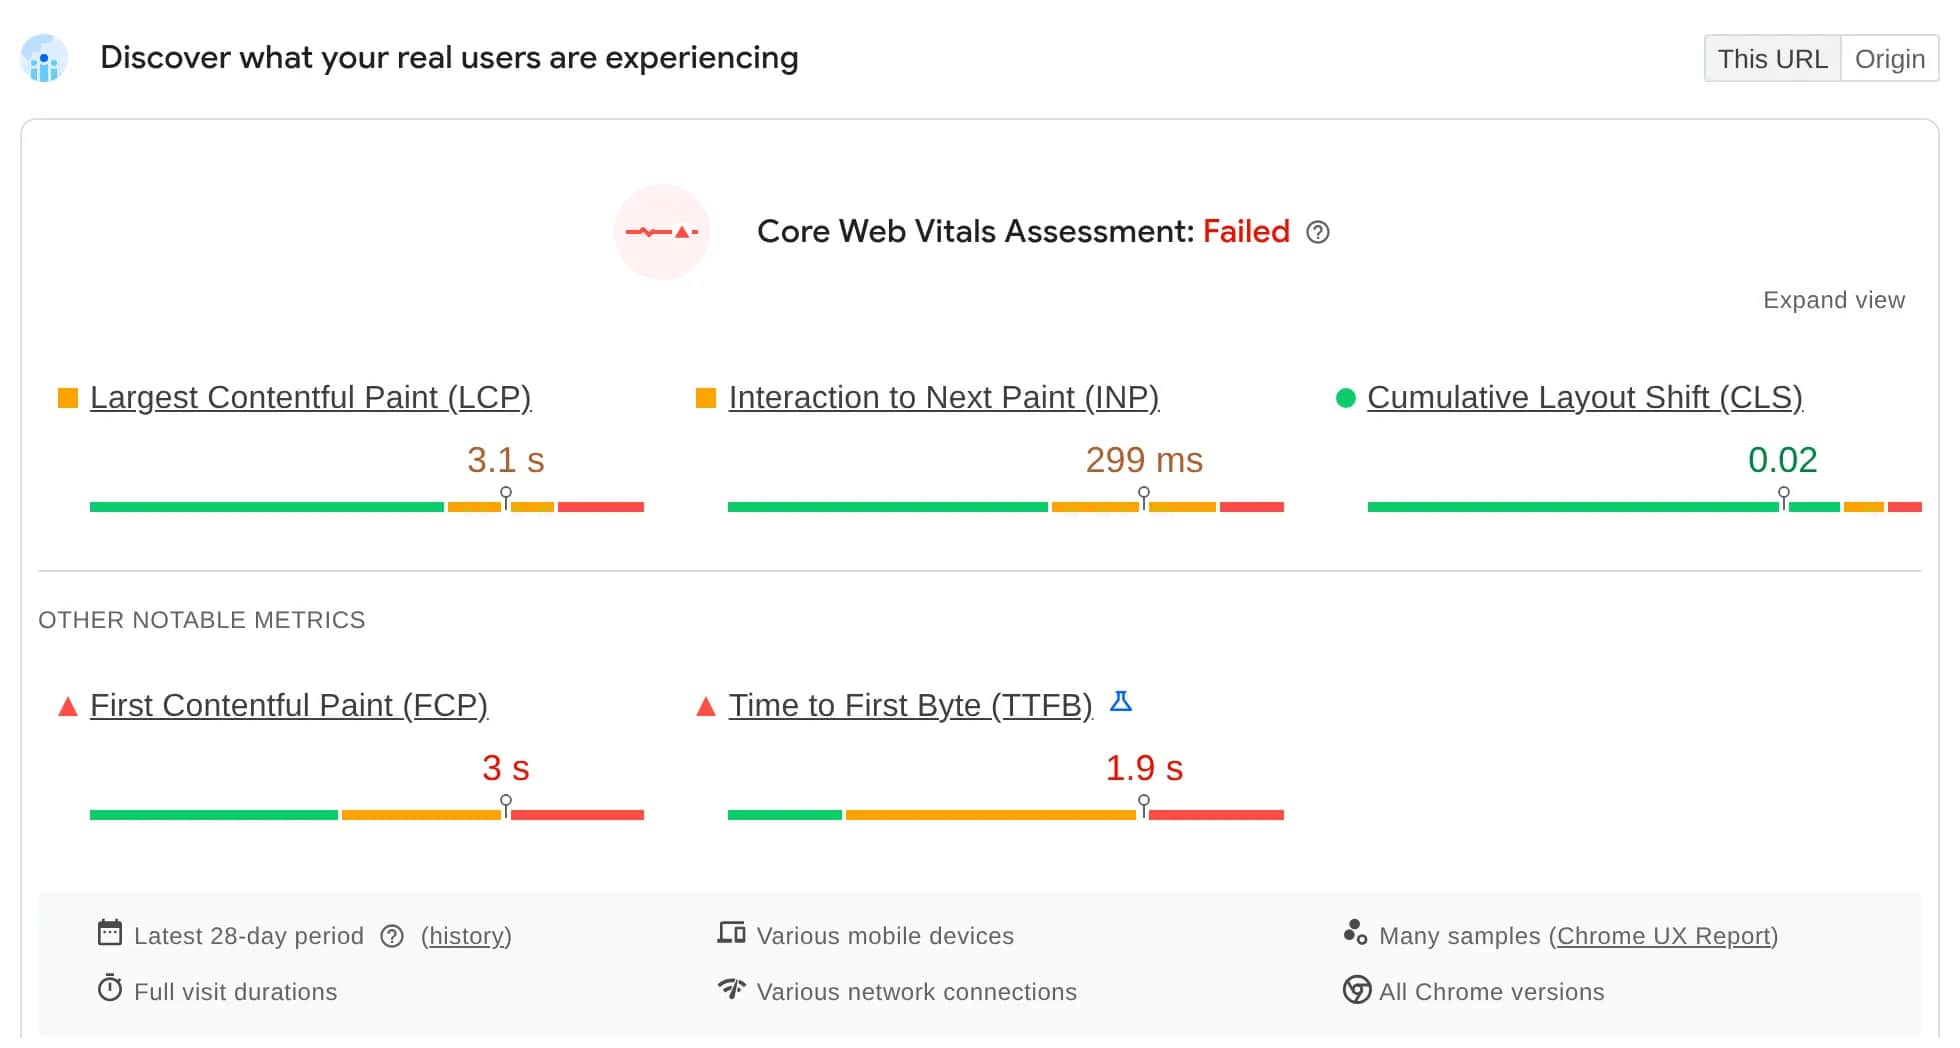
Top half of the report: real Chrome user data
PageSpeed Insights (pagespeed.web.dev, hl=en), report for developer.chrome.com, mobile, run 4 October 2026, 17:15 UTC
This page or the whole origin
PSI first looks for data on the exact page. If there isn't enough, it moves up a level. In Google's words: "A page might not have sufficient data if it has been recently published or has too few samples from real users. When this happens, PSI will fall back to origin-level granularity, which encompasses all user experiences on all pages of the website. Sometimes the origin may also have insufficient data, in which case PSI will be unable to show any real-user experience data" (About PageSpeed Insights, accessed 3 October 2026). In the API response these are two separate objects: loadingExperience for the page and originLoadingExperience for the origin (runPagespeed documentation, page from 3 September 2024).
That explains something that often looks like a bug: a page's numbers can change although nothing on that page has. Origin-level data covers every pageview on every page of the site, so a change to another page, or a shift in traffic between pages, moves "your" page's numbers too. On top of that, the 28-day window moves forward daily and the oldest pageviews drop out. Before comparing two readings, check that both cover the same scope.
Why there may be no data at all
Only public, indexable pages make it into CrUX. CrUX methodology applies "the same indexability criteria as search engines": a page is excluded if, after redirects, it answers with a status other than 200, carries an X-Robots-Tag: noindex header, or has a <meta name="robots" content="noindex"> tag (CrUX methodology, page from 20 June 2024, accessed 3 October 2026).
The second condition is popularity, and Google doesn't publish the threshold: "An exact number is not disclosed … The minimum number is the same for pages and origins." Pages below it are not in the dataset, and you can't ask for them to be added: "At this time, you cannot manually submit pages or origins for inclusion" (same source). Only Chrome users on desktop and Android who have usage-statistics reporting and history sync turned on, with no sync passphrase, are counted; Chrome on iOS doesn't report to CrUX. What missing field data means for a small business site is covered in our article on Core Web Vitals.
The bars, and the number above them
Each metric has a bar split into three colours: good, needs improvement and poor. Google's example: "seeing 11% within LCP's amber bar indicates that 11% of all observed LCP values fall between 2500ms and 4000ms". The number above the bar is not an average: "Above the distribution bars, PSI reports the 75th percentile for all metrics" (About PageSpeed Insights, accessed 3 October 2026). The value above the LCP bar therefore means that three-quarters of pageviews had an LCP at least that good and a quarter had a worse one.
When a page passes the Core Web Vitals assessment
The assessment covers three metrics: INP, LCP and CLS. PSI's rule has two edge cases: "the aggregation passes the Core Web Vitals assessment if the 75th percentiles of all three metrics are Good. Otherwise, the aggregation does not pass the assessment. If the aggregation has insufficient data for INP, then it will pass the assessment if both the 75th percentiles of LCP and CLS are Good. If either LCP or CLS have insufficient data, the page or origin-level aggregation cannot be assessed" (same source). So missing INP data doesn't block passing, while missing LCP or CLS data makes an assessment impossible.
The thresholds of the three metrics (LCP 2.5 s, INP 200 ms, CLS 0.1 at the 75th percentile) and what breaks them are covered in our article on Core Web Vitals. The report shows two more metrics that don't count toward the assessment but have their own thresholds in PSI's table (same source):
- FCP: good up to 1,800 ms, needs improvement above 1,800 ms up to 3,000 ms, poor above 3,000 ms;
- TTFB (experimental): good up to 800 ms, needs improvement above 800 ms up to 1,800 ms, poor above 1,800 ms.
Two readings, 4 October 2026
We checked what the PageSpeed Insights API returns for our own domain and for a high-traffic site. For www.digitalvantage.eu the response contained no field data at all, for either the page or the origin: our site doesn't have enough measurements in CrUX. Less than a minute later the API returned full field data for web.dev: overall category SLOW, LCP 3,133 ms, INP 218 ms and CLS 0.01 at the 75th percentile. So even a site devoted to web performance missed the LCP and INP thresholds. This is a single reading through the API, not the interface, and it covers the 28-day window before that date.
The bottom half: where the 0–100 score comes from
The performance score is a weighted average of five lab metrics from one simulated page load — not an assessment of real-user experience. Google gives the bands: "A score of 90 or above is considered good. 50 to 89 is a score that needs improvement, and below 50 is considered poor", and immediately adds a caveat: "having good lab data does not necessarily mean real-user experiences will also be good" (About PageSpeed Insights, accessed 3 October 2026).
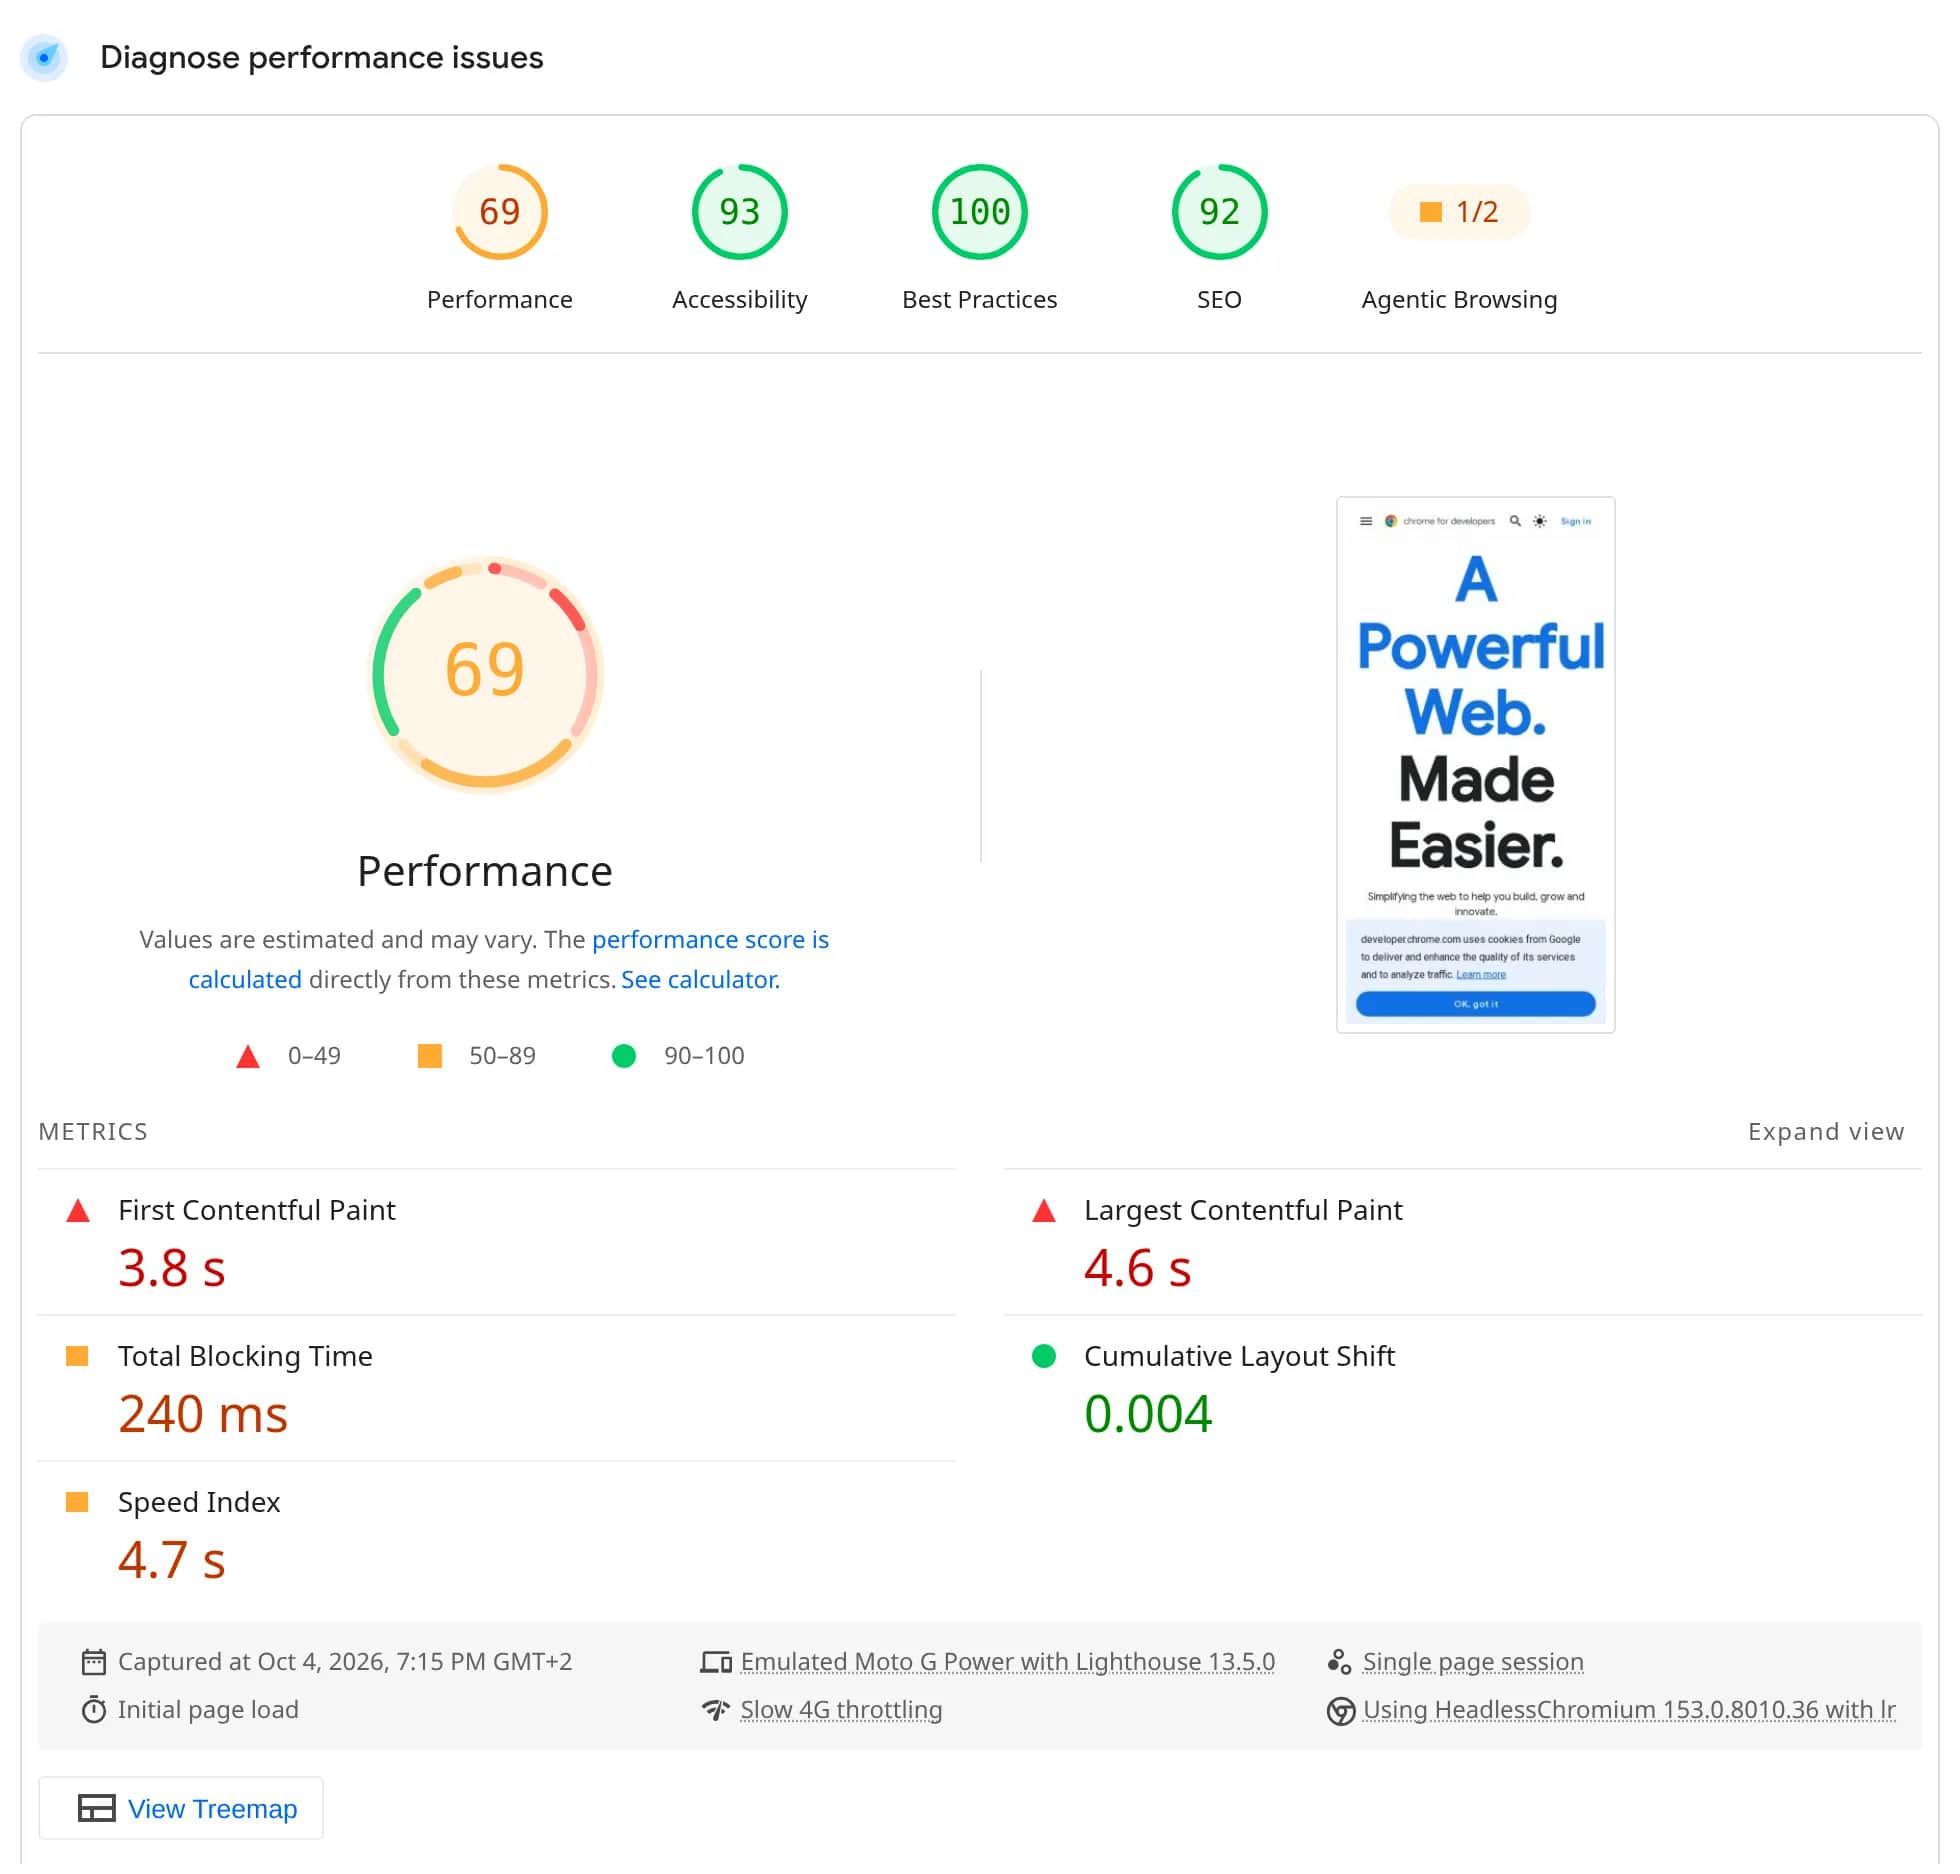
Bottom half of the report: a Lighthouse score from a single run
PageSpeed Insights (pagespeed.web.dev, hl=en), report for developer.chrome.com, mobile, run 4 October 2026, 17:15 UTC
Only metrics count toward the score: "The Performance score is a weighted average of the metric scores" and "only metrics contribute to your Lighthouse Performance score, not the results of Opportunities or Diagnostics" (Lighthouse performance scoring, page from 19 September 2019, accessed 3 October 2026; weights confirmed in the Lighthouse configuration, accessed 3 October 2026). The recommendations below the score help you find causes, but they add or subtract no points.
The metrics are not weighted equally. According to the Lighthouse documentation, LCP weighs 25% and Total Blocking Time 30%, so those two make up 55% of the score; FCP, Speed Index and CLS share the remaining 45%. The full weight table, and why the heaviest metric is not a Core Web Vital, are in our article on Core Web Vitals.
Why 90 to 100 is the most expensive stretch
Each metric earns points on a curve based on HTTP Archive data: "The 25th percentile of HTTP Archive data becomes a score of 50 … and the 8th percentile becomes a score of 90". The curve flattens at the top end: "taking a score from 99 to 100 needs about the same amount of metric improvement that would take a 90 to 94" (Lighthouse performance scoring, accessed 3 October 2026). Going from 99 to 100 takes roughly as much metric improvement as going from 90 to 94. If someone offers to "get you to 100", you are paying for the most expensive stretch of the scale.
Why there's no INP in the bottom half
The lab test in PSI only loads the page. Nobody clicks anything, so there is no interaction to measure. Google explains: "some lab tools won't report a page's INP because they only observe the loading of a page without any interactions. In such cases, Total Blocking Time (TBT) may be a reasonable proxy metric for INP, but it's not a substitute for INP in and of itself" (web.dev, Interaction to Next Paint, updated 2 September 2025, accessed 3 October 2026). TBT measures main-thread blocking during load, not how the page reacts to a specific click.
That doesn't mean Lighthouse can never measure INP. In Timespan mode, available among other places in the Lighthouse panel of Chrome DevTools, Lighthouse records a period in which you interact with the page yourself, and only in that mode does its INP audit run (Lighthouse's INP audit source, accessed 3 October 2026). But such a measurement depends on what you do: a lab INP value "will be dependent on what interactions are performed during the measurement period" (web.dev), and a Timespan report doesn't produce an overall performance score (Lighthouse, user flows, accessed 3 October 2026). How INP differs from TBT, and what hurts it, is covered in our article on Core Web Vitals.
Phone and desktop: what settings PageSpeed Insights measures with
The report has two tabs, phone and desktop, and each measures under different assumptions about the device, the connection and the CPU. The phone settings model a weak mobile connection. The Lighthouse documentation says network throttling is meant to emulate "the ~85th percentile mobile connection speed"; a profile with 150 ms of latency and 1.6 Mb/s down / 750 kb/s up represents "roughly the bottom 25% of 4G connections and top 25% of 3G connections", and the profile is named "Slow 4G", which "used to be labeled as "Fast 3G"" (Lighthouse, Network Throttling, accessed 3 October 2026). This is not 4G in the everyday sense, but a weak mobile connection.
The CPU is slowed by a factor of four: "By default, Lighthouse uses a constant 4x CPU multiplier", which, according to the same documentation, moves a typical run from the high-end desktop bracket "somewhere into the mid-tier mobile bracket" (same source). The emulated device is a moto g power (2022): the Lighthouse configuration names it, and the same model appeared in the user-agent header of the PSI API response we received on 3 October 2026 (Chrome 153). Desktop is measured at 40 ms latency, 10 Mb/s bandwidth and no CPU slowdown. The "About PageSpeed Insights" page still names an older phone; on this point the Lighthouse code is the current reference.
What settings Lighthouse uses to measure phone and desktop
Lighthouse (GitHub, core/config/constants.js, docs/throttling.md), Chrome DevTools Lantern constants, PageSpeed Insights API response of 3 October 2026; accessed 3 October 2026
One caveat about this table. PSI doesn't publish these values, and its API doesn't return them. They come from the Lighthouse code, and the claim that PSI uses them rests on one sentence in the Lighthouse documentation: simulated throttling "remains the default setting. This matches the setup of PageSpeed Insights and the Lighthouse CLI default" (Lighthouse, Network Throttling).
Simulated throttling, not physical throttling
"Simulated" is meant literally. PSI doesn't physically limit the connection or the CPU during the test. Lighthouse loads the page without restrictions, then calculates how that load would have gone on a slow network and a weaker CPU: simulated throttling "uses a simulation of a page load, based on the data observed in the initial unthrottled load" (same source). That is why the documentation warns that if you open the original trace afterwards, "the trace values will not match up with Lighthouse's metric results, as the original trace is prior to the simulation". The same documentation openly says that the simulation has edge cases and that other methods suit an in-depth investigation better.
This explains why a PSI score differs from a Lighthouse score run locally on a fast machine. Locally, the simulation starts from a load measured on your hardware and your connection, and the 4x CPU slowdown is applied to your machine, not to Google's server; the Lighthouse documentation says explicitly that on a weaker machine you can lower that multiplier (same source). You can also choose a different method, DevTools throttling, which slows down the requests themselves.
Why phone scores worse, and what that means for the API
The phone score is usually lower for a simple reason: the profile assumes a slower network and a CPU four times slower, so every kilobyte and every millisecond of script execution costs more. In addition, since Lighthouse 6 desktop has had its own, stricter scoring curves (Lighthouse performance scoring), so the two tabs' scores can't be compared point for point. How to design a site with phones in mind is covered in our article on responsive web design.
A trap in automated measurement: the strategy parameter in the API is described as "The analysis strategy (desktop or mobile) to use, and desktop is the default" (runPagespeed documentation, page from 3 September 2024, accessed 3 October 2026). A script that calls the API without strategy=mobile measures desktop, the gentler profile.
Why the PageSpeed score changes even though you changed nothing
The lab score is designed to vary between runs, so a single test never proves that something got better or worse. The Lighthouse documentation says so outright: "Lighthouse performance scores will change due to inherent variability in web and network technologies, even if there hasn't been a code change. Run Lighthouse multiple times and beware of variability before drawing conclusions" (Lighthouse, Score Variability, accessed 3 October 2026).
The same document rates how likely each source of variability is in PageSpeed Insights:
- certain: browser non-determinism;
- probable: non-determinism of the page itself, and the server it runs on;
- possible: the backbone network and resource-sharing on the testing machine;
- unlikely: the local network and the client's own hardware.
The last point matters in practice: in PSI your Wi-Fi and your laptop are unlikely to explain the swings, because the test runs on Google's servers. In Chrome DevTools, where the test runs on your own computer, the hardware and its load do matter (more on that below). Google's scoring page also lists causes on the site's side: A/B tests, ads, traffic routing (Lighthouse performance scoring). If a page loads a different set of ads each time, each test measures a slightly different page.
We tested this on 3 October 2026 on developer.chrome.com, a Google site. Three PSI runs on the phone tab within five minutes scored 55, 62 and 72, while the top half showed the same user data every time: LCP 3.1 s, INP 297 ms, CLS 0.02. The 17-point spread is the test's own variability and nothing else.
The answer is aggregation. The Lighthouse document states: "The median Lighthouse score of 5 runs is twice as stable as 1 run", and recommends you "aggregate values like the median, 90th percentile, or even min/max instead of single test results" (same source). We run the test five times and take the median; the full procedure is in our article on website testing.
Which address to enter into PageSpeed Insights
Test the final address, the one the page actually opens at, not a version that redirects. When we ran https://digitalvantage.eu/ (without "www") through the PSI API on 4 October 2026, the result came with a warning that the test URL "was redirected to https://www.digitalvantage.eu/. Try testing the second URL directly." Since 2022 PSI has tried to follow redirects itself before the analysis (PSI release notes, entry of 10 May 2022, accessed 3 October 2026), but the warning makes clear which address is worth measuring.
For field data, what counts is the address in the form CrUX knows it. CrUX methodology sets three rules (CrUX methodology, accessed 3 October 2026):
- query parameters and fragments are stripped, so to CrUX an address with
?utm_medium=emailor#mainis the same as one without them; - in single-page applications, transitions between views are attributed to the first pageview;
- a page with
noindex, or with a status other than 200, has no field data at all.
One more thing: don't test only the homepage. In Web Almanac 2025, homepages passed Core Web Vitals less often than other pages (details below). Measure the pages people actually land on from search and ads.
Lighthouse in Chrome DevTools vs PageSpeed Insights
Lighthouse is the engine inside PSI, but run in your own browser it also measures your computer. Google describes it as "an open-source, automated tool" that can be run "in Chrome DevTools, from the command line, or as a Node module" (Lighthouse overview, page from 2 June 2025, accessed 3 October 2026). In Chrome it is a separate panel in the developer tools (DevTools).
The panel's documentation describes the differences (Lighthouse in Chrome DevTools, updated 15 October 2025, accessed 3 October 2026):
- the score depends on your own setup: "Lighthouse is influenced by your setup, including other load happening on your device, Chrome extensions, and any device settings you've stored in cookies, local storage, or similar";
- incognito mode helps, but not entirely: "even then this may still be subject to these influences";
- which is why "you cannot directly compare two Lighthouse audits completed on different machines";
- PSI and CI tools run on dedicated servers "may produce a "cleaner" and more consistent Lighthouse audits".
In return, DevTools can do things PSI can't. It can audit a page behind a login: Google lists "Audit pages that require authentication" among Lighthouse's uses (Lighthouse overview). It lets you choose the device and the audit categories: "Many Lighthouse tools (for example PageSpeed Insights) don't offer the option to choose the device type or audit categories". Besides the default Navigation mode it has Timespan and Snapshot modes, and DevTools throttling alongside simulated throttling.
The practical split: PSI for comparable measurements of public pages, DevTools for pages behind a login and for work on a specific interaction. For tracking down the cause of a problem, Google points elsewhere: "When using DevTools to debug performance problems, we recommend the Performance panel over Lighthouse" (same source).
Lighthouse 13: audits turned into "insights"
If you compare a report with a guide from a year ago, the list of recommendations below the score may look completely different; the scoring won't. Lighthouse 13.0 (Chrome blog post, 10 October 2025) replaced the previous performance audits with "insights", shared with the Performance panel in DevTools. Google is explicit: "There are no changes to the performance scoring in this version of Lighthouse, which is based on the metrics rather than the audits. Only the non-scored audits are changing" (Lighthouse 13.0, accessed 3 October 2026).
For anyone reading a report this means two things. Screenshots and lists of "opportunities" in older guides may not match what you see. And the 0–100 score is calculated as before, from the same five metrics with the same weights.
The latest release is Lighthouse 13.5.0, published on 18 September 2026 (Lighthouse releases on GitHub, accessed 3 October 2026). In our PSI API calls on 3 October 2026 the lighthouseVersion field read 13.5.0, so PSI was running that version.
The PageSpeed Insights API: the key, limits and an announced change
The PageSpeed Insights API returns the same data as the interface, but its defaults differ and an announced change affects anyone building automated monitoring. A key is optional: "The API can be used with or without an API key, although a key is recommended for frequent, automated queries" (PSI API, Get Started, page from 28 August 2025, accessed 3 October 2026).
Google's PSI documentation gives no numbers for the limits. Without a key you hit a limit quickly; with one, the limit is shown in the Google Cloud console. Our own call without a key on 3 October 2026 returned HTTP 429, reporting that the daily quota had been exceeded, with the quota value given as 0. That is one observation: we don't know whether it is a fixed setting or an exhausted shared pool.
Two defaults catch people out in their first script. Without the category parameter, the API only runs performance: "if none are given, only Performance category will be run". Without strategy, it measures desktop (runPagespeed documentation). Field data comes back as two objects: loadingExperience for the page and originLoadingExperience for the origin.
Most important is an announcement in the documentation itself: "We plan to discontinue including real-world data from the Chrome User Experience Report in this API. We recommend the CrUX API (guide) or the CrUX History API (guide) instead" (PSI API, Get Started). Google has given no date, and on 3 October 2026 the API still returned field data. If you are building monitoring for the long term, take field data from the CrUX API from the start: it is free, limited to 150 queries per minute per Google Cloud project, updated daily around 04:00 UTC with no guaranteed time, and about two days behind the current date (CrUX API, page from 11 February 2025, accessed 3 October 2026).
How other sites compare: Web Almanac 2025
Roughly one site in two worldwide has good Core Web Vitals, and a comparison across years shows that the two halves of a PSI report really do move independently. Chapter 7, "Performance", of Web Almanac 2025 is based on July 2025 measurements from HTTP Archive and CrUX (Web Almanac 2025, Performance, published 15 January 2026, accessed 3 October 2026). These are global figures, with no breakdown by country.
According to Web Almanac, 48% of sites had good Core Web Vitals on phones in 2025 and 56% on desktop, up from 44% and 55% a year earlier and 36% and 48% in 2023. The thousand most popular sites do only slightly better: 51% and 59%. Homepages passed less often than other pages — 45% on phones and 47% on desktop, versus 56% and 61% (same source).
What share of pages have good Core Web Vitals
HTTP Archive, Web Almanac 2025, ch. 7 Performance (July 2025 data, global); accessed 3 October 2026
By metric, the shares with a good result on phones and desktop were: LCP 62% and 74%, INP 77% and 97%, CLS 81% and 72%. The most telling comparison is lab against field. The median lab TBT on phones rose from 1,209 ms in 2024 to 1,916 ms in 2025, while the share of pages with good field INP on phones rose over the same period, from 74% to 77% (same source). The lab indicator got worse while the field indicator improved, which is exactly why the bottom half of a report should not be read as a forecast of the top half. Results for ecommerce platforms, from chapter 13 of the same report, are in our article on Core Web Vitals in ecommerce.
What to do with the result
What to do next depends on which half of the report you have. If the top half shows field data and the assessment fails, start with the metric outside its threshold; what causes it, and in what order to fix things, is covered in our article on Core Web Vitals. If there is no field data, treat the Lighthouse score as a diagnostic and measure by procedure, not with a single test: see our article on website testing. To assess many pages at once, use the Core Web Vitals report in Google Search Console, which groups similar pages; Google notes that a single page's PSI statistics "might not match the group results in Core Web Vitals" (Search Console help, Core Web Vitals report, accessed 3 October 2026). How to read this and the other reports is covered in our article on Google Search Console.
You can see both halves of the report for your own site in our website speed test. It shows real Chrome user data from the last 28 days, labelled as page-level or site-wide (or a message that there is none), and assesses it against the Core Web Vitals thresholds. Separately, it shows a Lighthouse lab test in which TBT stands in for INP.
FAQ
Frequently asked questions about PageSpeed Insights
PSI first looks for real-user data about the exact page you entered. If the page has too few pageviews, or was published too recently, PSI falls back to origin-level data, covering every pageview across every page on the site. That's why the numbers for a page can change even though nothing changed on it — a change on another page, or a shift in traffic between pages, is enough. If even the origin doesn't have enough data, PSI won't show any field data at all.
Because the phone test assumes weaker conditions. Lighthouse emulates a moto g power (2022) phone, a "Slow 4G" connection (150 ms latency, 1.6 Mb/s down) and a CPU slowed by a factor of four, while desktop is measured at 40 ms latency, 10 Mb/s and no CPU slowdown — on top of that, desktop has its own, stricter scoring curves. These values come from Lighthouse's own code; PSI doesn't publish them, but the Lighthouse documentation states that its defaults match PSI. The throttling is simulated: Lighthouse loads the page with no restrictions and calculates how the load would have gone under those conditions.
The engine is the same; the environment isn't. PSI runs Lighthouse on Google's own servers, so results are usually cleaner and more comparable. Lighthouse in Chrome DevTools runs on your own machine and, per Google's documentation, depends on your device's load, your extensions, and data stored in your browser, even in incognito mode. In exchange, DevTools can audit pages that require login, let you choose the device and the audit categories, and offers Timespan and Snapshot modes — none of which PSI offers.
Because the Lighthouse score changes between runs even without any code change — in PSI, due to non-determinism in the browser, the page itself and the server. The Lighthouse documentation states that the median of 5 runs is twice as stable as a single measurement, and recommends using aggregated values, such as the median, instead of a single test result.
Yes. An API key isn't required, but Google recommends one for frequent, automated queries; without a key you hit a limit quickly, and with one the limit is visible in the Google Cloud console. By default the API measures desktop and only the performance category, so for phone you need strategy=mobile. Google has announced — without a date — that it will stop including CrUX field data in this API, and recommends the CrUX API instead.
PageSpeed Insights report showing a problem, but you don't know where to start?
We'll go through both halves of the report with you: the user data and the lab test. We'll pin down which metric actually needs work, and what's causing it on your page.
Related Posts
- Website tools — six situations and the one text that fits yours
Six situations: choosing a system, building it yourself, WordPress editors, checking a finished site, and measuring it. Start with the one that is yours.
- 1.Google Search Console — what it is and how to use it in business
Google Search Console without guesswork: verification, agency access, CTR and average position by Google's own definitions, and page indexing statuses.
- 2.WordPress themes — how to choose one you will not be replacing in a year
WordPress themes are not chosen on looks: three fields in the directory tell you what a theme will cost you in a year, and what disappears when you switch.
- 3.Website builder — what it costs after year one and what you can take with you
Four pricing mechanisms hidden in builder plans, what the second year actually costs, and what you can export when you outgrow the tool.
- 4.WordPress page builder — what a visual editor costs and when it stops paying
Gutenberg, Elementor or Divi: renewal prices, the plugin bill nobody quotes, and three thresholds where a visual editor costs more than it saves.
- 5.Website testing — how to check a site so the result means something
Why a single measurement proves nothing, how a lab score differs from field data, and what to check before a site goes live and before you sign it off.
- 6.Content management system — who in the company gets to change what
What a CMS actually solves, the three families worth knowing, and how to choose before anyone says a product name. With a change-frequency matrix.
- 7.Website analytics — what your numbers do when people refuse cookies
What happens to the data when someone clicks reject, why a small site never gets GA4 modelling, and why one consent instead of three costs you data.
- 8.Complete WordPress Setup Guide - how to create a professional company website step-by-step
Learn more about Wordpress Setup. A practical guide with concrete tips and examples. Learn best practices and avoid common mistakes.
- 1.
About the Team
Digital Vantage Team
Your Partner in Business, Digital Vantage Team
Digital Vantage team is a group of experienced professionals combining expertise in web development, software engineering, DevOps, UX/UI design and digital marketing. Together we carry out projects from concept to implementation - websites, e-commerce stores, dedicated applications and digital strategies. Our team combines years of experience from technology corporations with the flexibility and immediacy of working in a smaller, close-knit structure. We work in agile methodologies, focus on transparent communication and treat each project as if it were our own business. The strength of the team is the diversity of perspectives - from systems architecture and infrastructure, frontend and design, to SEO and content marketing strategy. As a result, the client receives a cohesive solution where technology, aesthetics and business goals go hand in hand.